資料搜尋諮詢服務
找不到您所需要的資料嗎?
我們能協助您找到最符合您研究需求的資訊
請撥打 +886-2-2799-3110
或透過電子郵件與我們聯絡 mi@hintoninfo.com
IHS_EWBIEEE xploreSTRATEGY ANALYTICSIHS_EWB_GF

頁面路徑選單

Artificial Intelligence (AI) Market by Technology (Machine Learning, Natural Language Processing, Image Processing, Speech Recognition), and Industry Vertical (Media & Advertising, BFSI, IT & Telecom, Retail, Healthcare, Automotive & Transportation, and Others) - Global Opportunity Analysis and Indu

  • LinkedIn
  • facebook
  • Twitter
出版日期:2018/07/01
頁  數:219頁
文件格式:PDF
價  格:
USD 5,540 (Single-User License)
USD 6,654 (Multi-User License)
USD 9,280 (Global-User License)
線上訂購或諮詢
 

Artificial Intelligence (AI) Market Overview:

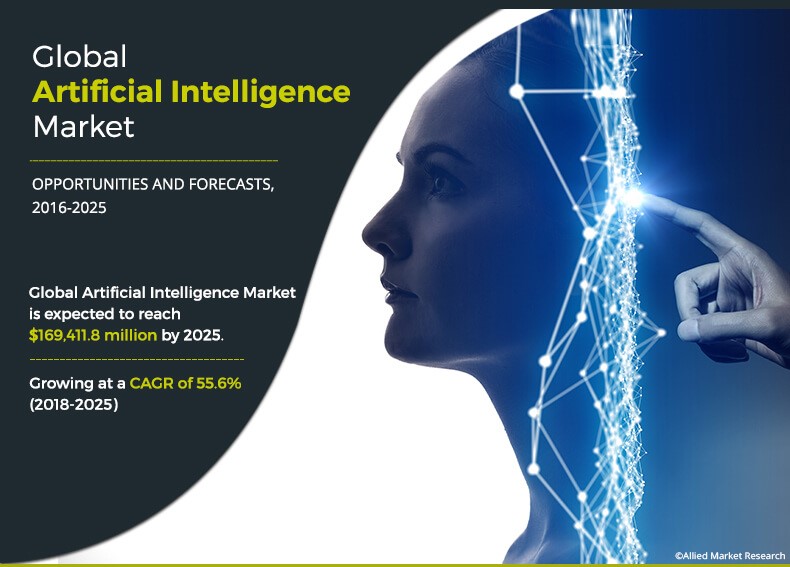
The global artificial intelligence market size is expected to reach $169,411.8 million in 2025, from $4,065.0 million in 2016 growing at a CAGR of 55.6% from 2018 to 2025. Artificial intelligence has been one of the fastest-growing technologies in recent years. AI is associated to human intelligence with similar characteristics such as language understanding, reasoning, learning, problem solving, and others. Manufacturers in the market witness enormous underlying intellectual challenges in the development and revision of such a technology. AI is positioned at the core of the next gen software technologies in the market. Companies such as Google, IBM, Microsoft, and other leading players have actively implemented AI as a crucial part of their technologies

Get more information on this report : Request Sample Pages


The report focuses on the growth prospects, restraints, and artificial intelligence market trends. The rise in number of innovative start-ups and advancements in technology have led to increase in investment in artificial intelligence technologies. Moreover, growth in demand for analyzing and interpreting large amounts of data is boosting the demand for artificial intelligence industry solutions. Furthermore, development of more reliable cloud computing infrastructures and improvements in dynamic artificial intelligence solutions have a strong impact on the growth potential of the AI market. However, lack of trained and experienced staff can hinder the growth of the artificial intelligence market.

The study provides Porter’s five forces analysis of the AI industry to understand the impact of various factors such as bargaining power of suppliers, competitive intensity of competitors, threat of new entrants, threat of substitutes, and bargaining power of buyers on the artificial intelligence market growth. Report also provides AI industry forecast for the period of 2017 to 2022.

Get more information on this report : Request Sample Pages

Segment Overview

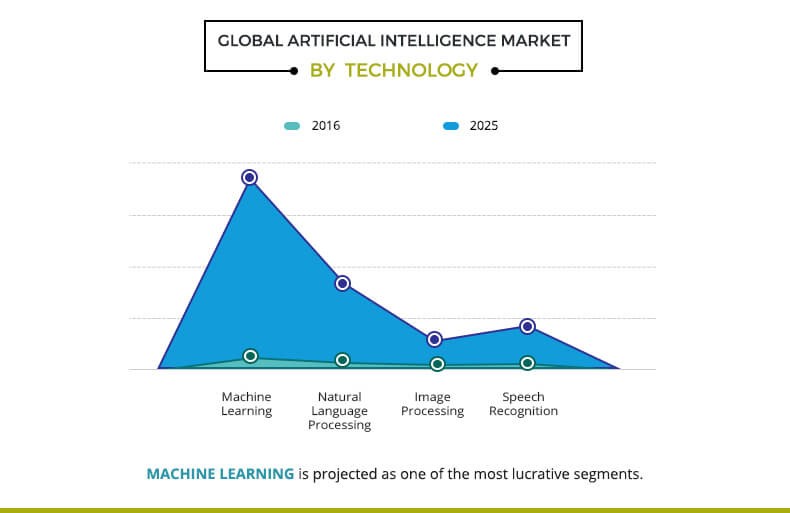
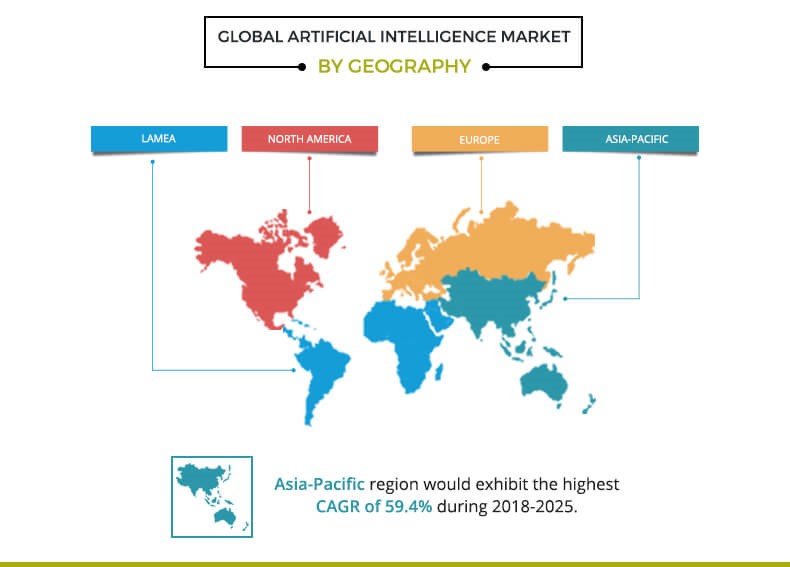
The AI market is segmented by technology, industry vertical, and geography. The various technologies are sub-divided into machine learning, natural language processing, image processing, and speech recognition. Based on industry verticals, the market is categorized into media & advertising, retail, telecom & IT, healthcare, automotive & transportation, and others (agriculture, law, educational institutions). Geographically, the market is analyzed across North America, Europe, Asia-Pacific, and LAMEA.

Get more information on this report : Request Sample Pages

According to technology segment, artificial intelligence market size was highest for the machine learning segment and is expected to maintain this trend in the coming years, owing to increase in demand for artificial intelligence industry solutions.

In 2017, North America region contributed for the highest AI market share and is anticipated to secure the leading position during the forecast period, owing to the presence of key companies and large investment in the artificial intelligence market.

Competition Analysis

Competitive analysis and profiles of the major artificial intelligence market leaders, such as Alphabet (Google Inc.), Apple Inc., Baidu, IBM, IPsoft, Microsoft Corporation, MicroStrategy, Inc., NVIDIA, Qlik Technologies Inc., and Verint Systems Inc (Next IT Corp) are provided in this report. The key strategies adopted by the key players from 2015 to 2018 were product launches, acquisitions, and collaboration.

Top impacting factors

Growing investment in AI technologies and growing need for analyzing and interpreting large amounts of data are expected to drive the growth of the artificial intelligence market. However, lack of trained and experienced staff is expected to restrict the growth of AI industry.


Increasing investment in AI technologies

The ability of the AI technology to analyze the collected data efficiently and forecast decisions through crucial algorithms helps in productivity improvement; for instance, Netflix suggests movies on the basis of users’ previous viewing experiences. In the current business scenario, AI has revolutionized the way of business management through integration of workflow management tools, brand purchase advertising, trend predictions, and other tools. These are the major factors of the increasing investment in AI technologies and machine learning market. Moreover, many small startups and tech companies have been investing in adoption of open-source AI platforms to achieve higher efficiencies in their value chains. Moreover, the growing availability of low-cost quality AI technologies is expected to also contribute to the growth of the market.

Growing need for analyzing and interpreting large amounts of data

AI has varied application areas including media & advertising, finance, retail, healthcare, automotive & transportation, agriculture, law, educational institutions, oil & gas, and other industries. This has driven the market of AI across the globe, owing to developments, such as self-driving cars, space exploration, accurate weather predictions, and others. Furthermore, AI is expected to affect healthcare advancements, owing to its ability to analyze huge amounts of genomic data and ensure more accurate treatment and prevention of medical conditions.

Lack of trained and experienced staff

Development of AI is possible after handling complex algorithms. Further, management of AI and automated systems is sometimes difficult. This requires exceptional software engineering skills and a notable experience of addressing distributed and concurrent programming or debugging with communication protocols. However, many regions, particularly the emerging economies, lack people with such skills. Hence, lack of skilled workforce is a prominent restraining force for the market.

Key Benefits for Stakeholders

  • The report provides an extensive analysis of the current and emerging market trends, and dynamics in the global artificial intelligence market.

  • In-depth analysis is conducted by constructing market estimations for the key market segments between 2018 and 2025.

  • Extensive artificial intelligence market analysis is conducted by following key product positioning and monitoring of the top competitors within the market framework.

  • A comprehensive analysis of all regions is provided to determine the prevailing opportunities in these geographies.

  • Key market players within the artificial intelligence market are profiled in this report and their strategies are analyzed thoroughly, which help in understanding the competitive outlook of the global artificial intelligence market.

Artificial Intelligence (AI) Market Key Segments:

By Technology

  • Machine learning
  • Natural language processing
  • Image processing
  • Speech recognition

By Industry Vertical

  • Media & advertising
  • BFSI
  • IT & Telecom
  • Retail
  • Healthcare
  • Automotive & transportation
  • ucational institutions)Others (agriculture, law, ed

By Geography

  • North America
    • U.S.
    • Canada
    • Mexico
  • Europe
    • UK
    • Germany
    • France
    • Russia
    • Rest of Europe
  • Asia-Pacific
    • China
    • Japan
    • India
    • Australia
    • Rest of Asia-Pacific
  • LAMEA
    • Latin America
    • Middle East
    • Africa

Key Players

  • Alphabet (Google Inc.)
  • Apple Inc.
  • Baidu
  • IBM Corporation
  • IPsoft
  • Microsoft Corporation
  • MicroStrategy, Inc.
  • NVIDIA  
  • Qlik Technologies Inc
  • Verint Systems Inc (Next IT Corp)
 

Chapter: 1: Introduction

1.1. Report description
1.2. Key benefits for stakeholders
1.3. Key market segments
1.4. Research methodology

1.4.1. Secondary research
1.4.2. Primary research
1.4.3. Analyst tools & models

Chapter: 2: Executive summary

2.1. CXO perspective

Chapter: 3: Market overview

3.1. Market definition and scope
3.2. Key findings

3.2.1. Top investment pockets
3.2.2. Top winning strategies

3.3. Porter's five forces analysis
3.4. Market share analysis, 2017
3.5. Market dynamics

3.5.1. Drivers

3.5.1.1. Increase in investment in AI technologies
3.5.1.2. Growth in demand for analyzing and interpreting large amounts of data
3.5.1.3. Increased customer satisfaction and increased adoption of reliable cloud applications

3.5.2. Restraint

3.5.2.1. Lack of trained and experienced staff

3.5.3. Opportunities

3.5.3.1. Increased adoption of AI in developing regions
3.5.3.2. Developing smarter robots

Chapter: 4: Artificial intelligence market, by technology

4.1. Market overview

4.1.1. Market size and forecast, by technology

4.2. Machine learning

4.2.1. Key market trends, growth factors, and opportunities
4.2.2. Market size and forecast, by region
4.2.3. Market analysis, by country

4.3. Natural language processing (NLP)

4.3.1. Key market trends, growth factors, and opportunities
4.3.2. Market size and forecast, by region
4.3.3. Market analysis, by country

4.4. Image processing

4.4.1. Key market trends, growth factors, and opportunities
4.4.2. Market size and forecast, by region
4.4.3. Market analysis, by country

4.5. Speech recognition

4.5.1. Key market trends, growth factors, and opportunities
4.5.2. Market size and forecast, by region
4.5.3. Market analysis, by country

Chapter: 5: Artificial intelligence market, BY industry vertical

5.1. Market overview

5.1.1. Market size and forecast, by industry vertical

5.2. Media & advertising

5.2.1. Key market trends, growth factors, and opportunities
5.2.2. Market size and forecast, by region
5.2.3. Market analysis, by country

5.3. BFSI

5.3.1. Key market trends, growth factors, and opportunities
5.3.2. Market size and forecast, by region
5.3.3. Market analysis, by country

5.4. IT & telecom

5.4.1. Key market trends, growth factors, and opportunities
5.4.2. Market size and forecast, by region
5.4.3. Market analysis, by country

5.5. Retail

5.5.1. Key market trends, growth factors, and opportunities
5.5.2. Market size and forecast, by region
5.5.3. Market analysis, by country

5.6. Healthcare

5.6.1. Key market trends, growth factors, and opportunities
5.6.2. Market size and forecast, by region
5.6.3. Market analysis, by country

5.7. Automotive & transportation

5.7.1. Key market trends, growth factors, and opportunities
5.7.2. Market size and forecast, by region
5.7.3. Market analysis, by country

5.8. Other

5.8.1. Key market trends, growth factors, and opportunities
5.8.2. Market size and forecast, by region
5.8.3. Market analysis, by country

Chapter: 6: Artificial intelligence market, BY region

6.1. Market overview
6.2. North America

6.2.1. Key market trends, growth factors, and opportunities
6.2.2. Market size and forecast, by technology
6.2.3. Market size and forecast, by industry vertical
6.2.4. Market size and forecast, by country

6.2.4.1. U.S.

6.2.4.1.1. U.S. market size and forecast, by technology
6.2.4.1.2. U.S. market size and forecast, by industry vertical6.2.4.2. Canada
6.2.4.2.1. Canada market size and forecast, by technology
6.2.4.2.2. Canada Market size and forecast, by industry vertical

6.2.4.3. Mexico

6.2.4.3.1. Mexico market size and forecast, by technology
6.2.4.3.2. Mexico market size and forecast, by industry vertical

6.3. Europe

6.3.1. Key market trends, growth factors, and opportunities
6.3.2. Market size and forecast, by technology
6.3.3. Market size and forecast, by industry vertical
6.3.4. Market size and forecast, by country

6.3.4.1. Germany

6.3.4.1.1. Germany market size and forecast, by technology
6.3.4.1.2. Germany market size and forecast, by industry vertical

6.3.4.2. UK

6.3.4.2.1. UK market size and forecast, by technology
6.3.4.2.2. UK market size and forecast, by industry vertical

6.3.4.3. France

6.3.4.3.1. France market size and forecast, by technology
6.3.4.3.2. France market size and forecast, by industry vertical

6.3.4.4. Russia

6.3.4.4.1. Russia market size and forecast, by technology
6.3.4.4.2. Russia market size and forecast, by industry vertical

6.3.4.5. Rest of Europe

6.3.4.5.1. Rest of Europe market size and forecast, by technology
6.3.4.5.2. Rest of Europe market size and forecast, by industry vertical

6.4. Asia-Pacific

6.4.1. Key market trends, growth factors, and opportunities
6.4.2. Market size and forecast, by technology
6.4.3. Market size and forecast, by industry vertical
6.4.4. Market size and forecast, by country

6.4.4.1. China

6.4.4.1.1. China market size and forecast, by technology
6.4.4.1.2. China market size and forecast, by industry vertical

6.4.4.2. Japan

6.4.4.2.1. Japan market size and forecast, by technology
6.4.4.2.2. Japan market size and forecast, by industry vertical

6.4.4.3. India

6.4.4.3.1. India market size and forecast, by technology
6.4.4.3.2. India market size and forecast, by industry vertical

6.4.4.4. Australia

6.4.4.4.1. Australia market size and forecast, by technology
6.4.4.4.2. Australia market size and forecast, by industry vertical
6.4.4.4.3. Rest of Asia-pacific market size and forecast, by technology
6.4.4.4.4. Rest of Asia-pacific market size and forecast, by industry vertical

6.5. LAMEA

6.5.1. Key market trends, growth factors, and opportunities
6.5.2. Market size and forecast, by technology
6.5.3. Market size and forecast, by industry vertical
6.5.4. Market size and forecast, by country

6.5.4.1. Latin America

6.5.4.1.1. Latin America market size and forecast, by technology
6.5.4.1.2. Latin America market size and forecast, by industry vertical

6.5.4.2. Middle East

6.5.4.2.1. Middle East market size and forecast, by technology
6.5.4.2.2. Middle East market size and forecast, by industry vertical

6.5.4.3. Africa

6.5.4.3.1. Africa market size and forecast, by technology
6.5.4.3.2. Africa market size and forecast, by industry vertical

Chapter: 7: Company profiles

7.1. Alphabet Inc. (Google Inc.)

7.1.1. Company overview
7.1.2. Company snapshot
7.1.3. Operating business segments
7.1.4. Product portfolio
7.1.5. Business performance
7.1.6. Key strategic moves and developments

7.2. Apple Inc.

7.2.1. Company overview
7.2.2. Company snapshot
7.2.3. Operating business segments
7.2.4. Product portfolio
7.2.5. Business performance
7.2.6. Key strategic moves and developments

7.3. Baidu, Inc.

7.3.1. Company overview
7.3.2. Company snapshot
7.3.3. Operating business segments
7.3.4. Product portfolio
7.3.5. Business performance
7.3.6. Key strategic moves and developments

7.4. International Business Management Corporation

7.4.1. Company overview
7.4.2. Company snapshot
7.4.3. Operating business segments
7.4.4. Product portfolio
7.4.5. Business performance
7.4.6. Key strategic moves and developments

7.5. IPsoft Inc.

7.5.1. Company overview
7.5.2. Company snapshot
7.5.3. Product portfolio
7.5.4. Key strategic moves and developments

7.6. Microsoft Corporation

7.6.1. Company overview
7.6.2. Company snapshot
7.6.3. Operating business segments
7.6.4. Product portfolio
7.6.5. Business performance
7.6.6. Key strategic moves and developments

7.7. MicroStrategy Incorporated

7.7.1. Company overview
7.7.2. Company snapshot
7.7.3. Operating business segment
7.7.4. Product portfolio
7.7.5. Business performance
7.7.6. Key strategic moves and developments

7.8. NVIDIA Corporation

7.8.1. Company overview
7.8.2. Company snapshot
7.8.3. Operating business segments
7.8.4. Product portfolio
7.8.5. Business performance
7.8.6. Key strategic moves and developments

7.9. Qlik Technologies Inc.

7.9.1. Company overview
7.9.2. Company snapshot
7.9.3. Operating business segments
7.9.4. Product portfolio
7.9.5. Key strategic moves and developments

7.10. Verint Systems Inc (Next IT Corporation)

7.10.1. Company overview
7.10.2. Company snapshot
7.10.3. Operating business segments
7.10.4. Product portfolio
7.10.5. Business performance
7.10.6. Key strategic moves and developments

LIST OF TABLES

TABLE 01. ARTIFICIAL INTELLIGENCE MARKET, BY TECHNOLOGY, 2016-2025 ($MILLION)
TABLE 02. ARTIFICIAL INTELLIGENCE MARKET REVENUE IN MACHINE LEARNING TECHNOLOGY, BY REGION, 2016-2025 ($MILLION)
TABLE 03. ARTIFICIAL INTELLIGENCE MARKET REVENUE IN NATURAL LANGUAGE PROCESSING TECHNOLOGY, BY REGION, 2016-2025 ($MILLION)
TABLE 04. ARTIFICIAL INTELLIGENCE MARKET REVENUE IN IMAGE PROCESSING TECHNOLOGY, BY REGION, 2016-2025 ($MILLION)
TABLE 05. ARTIFICIAL INTELLIGENCE MARKET REVENUE IN SPEECH RECOGNITION TECHNOLOGY, BY REGION, 2016-2025 ($MILLION)
TABLE 06. ARTIFICIAL INTELLIGENCE MARKET REVENUE, BY INDUSTRY VERTICAL, 2016-2025 ($MILLION)
TABLE 07. ARTIFICIAL INTELLIGENCE MARKET REVENUE IN MEDIA & ADVERTISING INDUSTRY, BY REGION, 2016-2025 ($MILLION)
TABLE 08. ARTIFICIAL INTELLIGENCE MARKET REVENUE IN MEDIA & ADVERTISING INDUSTRY, BY COUNTRY, 2016-2025 (%)
TABLE 09. ARTIFICIAL INTELLIGENCE MARKET REVENUE IN BFSI INDUSTRY, BY REGION, 2016-2025 ($MILLION)
TABLE 10. ARTIFICIAL INTELLIGENCE MARKET REVENUE IN BFSI INDUSTRY, BY COUNTRY, 2016-2025 (%)
TABLE 11. ARTIFICIAL INTELLIGENCE MARKET REVENUE IN IT & TELECOM INDUSTRY, BY REGION, 2016-2025 ($MILLION)
TABLE 12. ARTIFICIAL INTELLIGENCE MARKET REVENUE IN IT & TELECOM INDUSTRY, BY COUNTRY, 201672025 (%)
TABLE 13. ARTIFICIAL INTELLIGENCE MARKET REVENUE IN RETAIL INDUSTRY, BY REGION, 2016-2025 ($MILLION)
TABLE 14. ARTIFICIAL INTELLIGENCE MARKET REVENUE IN RETAIL INDUSTRY, BY COUNTRY, 2016-2025 (%)
TABLE 15. ARTIFICIAL INTELLIGENCE MARKET REVENUE IN HEALTHCARE INDUSTRY, BY REGION, 2016-2025 ($MILLION)
TABLE 16. ARTIFICIAL INTELLIGENCE MARKET REVENUE IN HEALTHCARE INDUSTRY, BY COUNTRY, 2016-2025 (%)
TABLE 17. ARTIFICIAL INTELLIGENCE MARKET REVENUE IN AUTOMOTIVE & TRANSPORTATION INDUSTRY, BY REGION, 2016-2025 ($MILLION)
TABLE 18. ARTIFICIAL INTELLIGENCE MARKET REVENUE IN AUTOMOTIVE & TRANSPORTATION INDUSTRY, BY COUNTRY, 2016-2025 (%)
TABLE 19. ARTIFICIAL INTELLIGENCE MARKET REVENUE IN OTHER INDUSTRY, BY REGION, 2016-2025 ($MILLION)
TABLE 20. ARTIFICIAL INTELLIGENCE MARKET REVENUE IN OTHER INDUSTRY, BY COUNTRY, 2016-2025 (%)
TABLE 21. NORTH AMERICA ARTIFICIAL INTELLIGENCE MARKET REVENUE, BY TECHNOLOGY, 2016-2025 ($MILLION)
TABLE 22. NORTH AMERICA ARTIFICIAL INTELLIGENCE MARKET REVENUE, BY INDUSTRY VERTICAL, 2016-2025 ($MILLION)
TABLE 23. NORTH AMERICA ARTIFICIAL INTELLIGENCE REVENUE, BY COUNTRY, 2016-2025 ($MILLION)
TABLE 24. U.S. ARTIFICIAL INTELLIGENCE MARKET REVENUE, BY TECHNOLOGY, 2016-2025 ($MILLION)
TABLE 25. U.S. ARTIFICIAL INTELLIGENCE MARKET REVENUE, BY INDUSTRY VERTICAL, 2016-2025 ($MILLION)
TABLE 26. CANADA ARTIFICIAL INTELLIGENCE MARKET REVENUE, BY TECHNOLOGY, 2016-2025 ($MILLION)
TABLE 27. CANADA ARTIFICIAL INTELLIGENCE MARKET REVENUE, BY INDUSTRY VERTICAL, 2016-2025 ($MILLION)
TABLE 28. MEXICO ARTIFICIAL INTELLIGENCE MARKET REVENUE, BY TECHNOLOGY, 2016-2025 ($MILLION)
TABLE 29. MEXICO ARTIFICIAL INTELLIGENCE MARKET REVENUE, BY INDUSTRY VERTICAL, 2016-2025 ($MILLION)
TABLE 30. EUROPE ARTIFICIAL INTELLIGENCE MARKET REVENUE, BY TECHNOLOGY, 2016-2025 ($MILLION)
TABLE 31. EUROPE ARTIFICIAL INTELLIGENCE MARKET REVENUE, BY INDUSTRY VERTICAL, 2016-2025 ($MILLION)
TABLE 32. EUROPE ARTIFICIAL INTELLIGENCE MARKET REVENUE, BY COUNTRY, 2016-2025 ($MILLION)
TABLE 33. GERMANY ARTIFICIAL INTELLIGENCE MARKET REVENUE, BY TECHNOLOGY, 2016-2025 ($MILLION)
TABLE 34. GERMANY ARTIFICIAL INTELLIGENCE MARKET REVENUE, BY INDUSTRY VERTICAL, 2016-2025 ($MILLION)
TABLE 35. UK ARTIFICIAL INTELLIGENCE MARKET REVENUE, BY TECHNOLOGY, 2016-2025 ($MILLION)
TABLE 36. UK ARTIFICIAL INTELLIGENCE MARKET REVENUE, BY INDUSTRY VERTICAL, 2016-2025 ($MILLION)
TABLE 37. FRANCE ARTIFICIAL INTELLIGENCE MARKET REVENUE, BY TECHNOLOGY, 2016-2025 ($MILLION)
TABLE 38. FRANCE ARTIFICIAL INTELLIGENCE MARKET REVENUE, BY INDUSTRY VERTICAL, 2016-2025 ($MILLION)
TABLE 39. RUSSIA ARTIFICIAL INTELLIGENCE MARKET REVENUE, BY TECHNOLOGY, 2016-2025 ($MILLION)
TABLE 40. RUSSIA ARTIFICIAL INTELLIGENCE MARKET REVENUE, BY INDUSTRY VERTICAL, 2016-2025 ($MILLION)
TABLE 41. REST OF EUROPE ARTIFICIAL INTELLIGENCE MARKET REVENUE, BY TECHNOLOGY, 2016-2025 ($MILLION)
TABLE 42. REST OF EUROPE ARTIFICIAL INTELLIGENCE MARKET REVENUE, BY INDUSTRY VERTICAL, 2016-2025 ($MILLION)
TABLE 43. ASIA-PACIFIC ARTIFICIAL INTELLIGENCE MARKET REVENUE, BY TECHNOLOGY, 2016-2025 ($MILLION)
TABLE 44. ASIA-PACIFIC ARTIFICIAL INTELLIGENCE MARKET REVENUE, BY INDUSTRY VERTICAL, 2016-2025 ($MILLION)
TABLE 45. ASIA-PACIFIC ARTIFICIAL INTELLIGENCE MARKET REVENUE, BY COUNTRY, 2016-2025 ($MILLION)
TABLE 46. CHINA ARTIFICIAL INTELLIGENCE MARKET REVENUE, BY TECHNOLOGY, 2016-2025 ($MILLION)
TABLE 47. CHINA ARTIFICIAL INTELLIGENCE MARKET REVENUE, BY INDUSTRY VERTICAL, 2016-2025 ($MILLION)
TABLE 48. JAPAN ARTIFICIAL INTELLIGENCE MARKET REVENUE, BY TECHNOLOGY, 2016-2025 ($MILLION)
TABLE 49. JAPAN ARTIFICIAL INTELLIGENCE MARKET REVENUE, BY INDUSTRY VERTICAL, 2016-2025 ($MILLION)
TABLE 50. INDIA ARTIFICIAL INTELLIGENCE MARKET REVENUE, BY TECHNOLOGY, 2016-2025 ($MILLION)
TABLE 51. INDIA ARTIFICIAL INTELLIGENCE MARKET REVENUE, BY INDUSTRY VERTICAL, 2016-2025 ($MILLION)
TABLE 52. AUSTRALIA ARTIFICIAL INTELLIGENCE MARKET REVENUE, BY TECHNOLOGY, 2016-2025 ($MILLION)
TABLE 53. AUSTRALIA ARTIFICIAL INTELLIGENCE MARKET REVENUE, BY INDUSTRY VERTICAL, 2016-2025 ($MILLION)
TABLE 54. REST OF ASIA-PACIFIC ARTIFICIAL INTELLIGENCE MARKET REVENUE, BY TECHNOLOGY, 2016-2025 ($MILLION)
TABLE 55. REST OF ASIA-PACIFIC ARTIFICIAL INTELLIGENCE MARKET REVENUE, BY INDUSTRY VERTICAL, 2016-2025 ($MILLION)
TABLE 56. LAMEA ARTIFICIAL INTELLIGENCE MARKET REVENUE, BY TECHNOLOGY, 2016-2025 ($MILLION)
TABLE 57. LAMEA ARTIFICIAL INTELLIGENCE MARKET REVENUE, BY INDUSTRY VERTICAL, 2016-2025 ($MILLION)
TABLE 58. LAMEA ARTIFICIAL INTELLIGENCE MARKET REVENUE, BY COUNTRY, 2016-2025 ($MILLION)
TABLE 59. LATIN AMERICA ARTIFICIAL INTELLIGENCE MARKET REVENUE, BY TECHNOLOGY, 2016-2025 ($MILLION)
TABLE 60. LATIN AMERICA ARTIFICIAL INTELLIGENCE MARKET REVENUE, BY INDUSTRY VERTICAL, 2016-2025 ($MILLION)
TABLE 61. MIDDLE EAST ARTIFICIAL INTELLIGENCE MARKET REVENUE, BY TECHNOLOGY, 2016-2025 ($MILLION)
TABLE 62. MIDDLE EASR ARTIFICIAL INTELLIGENCE MARKET REVENUE, BY INDUSTRY VERTICAL, 2016-2025 ($MILLION)
TABLE 63. AFRICA ARTIFICIAL INTELLIGENCE MARKET REVENUE, BY TECHNOLOGY, 2016-2025 ($MILLION)
TABLE 64. AFRICA ARTIFICIAL INTELLIGENCE MARKET REVENUE, BY INDUSTRY VERTICAL, 2016-2025 ($MILLION)
TABLE 65. ALPHABET: COMPANY SNAPSHOT
TABLE 66. ALPHABET: OPERATING SEGMENTS
TABLE 67. ALPHABET: PRODUCT PORTFOLIO
TABLE 68. APPLE INC.: COMPANY SNAPSHOT
TABLE 69. APPLE INC.: PRODUCT CATEGORIES
TABLE 70. ADIDAS AG: PRODUCT PORTFOLIO
TABLE 71. BAIDU, INC.: COMPANY SNAPSHOT
TABLE 72. BAIDU, INC.: OPERATING SEGMENTS
TABLE 73. BAIDU, INC.: PRODUCT PORTFOLIO
TABLE 74. IBM: COMPANY SNAPSHOT
TABLE 75. IBM: OPERATING SEGMENTS
TABLE 76. IBM: PRODUCT PORTFOLIO
TABLE 77. IPSOFT INC: COMPANY SNAPSHOT
TABLE 78. IPSOFT INC: PRODUCT PORTFOLIO
TABLE 79. MICROSOFT CORPORATION: COMPANY SNAPSHOT
TABLE 80. MICROSOFT CORPORATION: OPERATING SEGMENTS
TABLE 81. MICROSOFT CORPORATION: PRODUCT PORTFOLIO
TABLE 82. MICROSTRATEGY INCORPORATED: COMPANY SNAPSHOT
TABLE 83. MICROSTRATEGY INCORPORATED: PRODUCT PORTFOLIO
TABLE 84. NVIDIA: COMPANY SNAPSHOT
TABLE 85. NVIDIA: OPERATING SEGMENTS
TABLE 86. NVIDIA: PRODUCT PORTFOLIO
TABLE 87. QLIK TECHNOLOGIES INC: COMPANY SNAPSHOT
TABLE 88. QLIK TECHNOLOGIES INC: PRODUCT CATEGORIES
TABLE 89. QLIK TECHNOLOGIES INC: PRODUCT PORTFOLIO
TABLE 90. VERINT SYSTEMS INC: COMPANY SNAPSHOT
TABLE 91. VERINT SYSTEMS INC: OPERATING SEGMENTS
TABLE 92. VERINT SYSTEMS INC: PRODUCT PORTFOLIO

LIST OF FIGURES

FIGURE 01. GLOBAL ARTIFICIAL INTELLIGENCE MARKET, 20172025
FIGURE 02. GLOBAL ARTIFICIAL INTELLIGENCE MARKET: KEY PLAYERS
FIGURE 03. TOP INVESTMENT POCKETS
FIGURE 04. TOP WINNING STRATEGIES, BY YEAR, 2015-2018*
FIGURE 05. TOP WINNING STRATEGIES, BY DEVELOPMENT, 2015-2018* (%)
FIGURE 06. TOP WINNING STRATEGIES, BY COMPANY, 2015-2018*
FIGURE 07. MODERATE-TO-HIGH BARGAINING POWER OF SUPPLIERS
FIGURE 08. HIGH BARGAINING POWER OF BUYERS
FIGURE 09. LOW THREAT OF SUBSTITUTES
FIGURE 10. MODERATE-TO-HIGH THREAT OF NEW ENTRANTS
FIGURE 11. HIGH COMPETITIVE RIVALRY
FIGURE 12. MARKET SHARE ANALYSIS OF ARTIFICIAL INTELLIGENCE COMPANIES (%), 2017
FIGURE 13. ARTIFICIAL INTELLIGENCE MARKET: DRIVERS, RESTRAINTS, AND OPPORTUNITIES
FIGURE 14. ARTIFICIAL INTELLIGENCE MARKET REVENUE IN MACHINE LEARNING TECHNOLOGY, BY COUNTRY, 2016-2025 (%)
FIGURE 15. ARTIFICIAL INTELLIGENCE MARKET REVENUE IN NATURAL LANGUAGE PROCESSING TECHNOLOGY, BY COUNTRY, 2016-2025 (%)
FIGURE 16. ARTIFICIAL INTELLIGENCE MARKET REVENUE IN IMAGE PROCESSING TECHNOLOGY, BY COUNTRY, 2016-2025 (%)
FIGURE 17. ARTIFICIAL INTELLIGENCE MARKET REVENUE IN SPEECH RECOGNITION TECHNOLOGY, BY COUNTRY, 2016-2025 (%)
FIGURE 18. U.S. ARTIFICIAL INTELLIGENCE MARKET REVENUE, 2016-2025 ($MILLION)
FIGURE 19. CANADA ARTIFICIAL INTELLIGENCE MARKET REVENUE, 2016-2025 ($MILLION)
FIGURE 20. MEXICO ARTIFICIAL INTELLIGENCE MARKET REVENUE, 2016-2025 ($MILLION)
FIGURE 21. GERMANY ARTIFICIAL INTELLIGENCE MARKET REVENUE, 2016-2025 ($MILLION)
FIGURE 22. UK ARTIFICIAL INTELLIGENCE MARKET REVENUE, 2016-2025 ($MILLION)
FIGURE 23. FRANCE ARTIFICIAL INTELLIGENCE MARKET REVENUE, 2016-2025 ($MILLION)
FIGURE 24. RUSSIA ARTIFICIAL INTELLIGENCE MARKET REVENUE, 2016-2025 ($MILLION)
FIGURE 25. REST OF EUROPE ARTIFICIAL INTELLIGENCE MARKET REVENUE, 2016-2025 ($MILLION)
FIGURE 26. CHINA ARTIFICIAL INTELLIGENCE MARKET REVENUE, 2016-2025 ($MILLION)
FIGURE 27. JAPAN ARTIFICIAL INTELLIGENCE MARKET REVENUE, 2016-2025 ($MILLION)
FIGURE 28. INDIA ARTIFICIAL INTELLIGENCE MARKET REVENUE, 2016-2025 ($MILLION)
FIGURE 29. AUSTRALIA ARTIFICIAL INTELLIGENCE MARKET REVENUE, 2016-2025 ($MILLION)
FIGURE 30. REST OF ASIA-PACIFIC REST OF ASIA-PACIFIC ARTIFICIAL INTELLIGENCE MARKET REVENUE, 2016-2025 ($MILLION)
FIGURE 31. LATIN AMERICA ARTIFICIAL INTELLIGENCE MARKET REVENUE, 2016-2025 ($MILLION)
FIGURE 32. MIDDLE EAST ARTIFICIAL INTELLIGENCE MARKET REVENUE, 2016-2025 ($MILLION)
FIGURE 33. AFRICA ARTIFICIAL INTELLIGENCE MARKET REVENUE, 2016-2025 ($MILLION)
FIGURE 34. ALPHABET: NET SALES, 2015-2017 ($MILLION)
FIGURE 35. ALPHABET: REVENUE SHARE BY SEGMENT, 2017 (%)
FIGURE 36. ALPHABET: REVENUE SHARE BY GEOGRAPHY, 2017 (%)
FIGURE 37. APPLE INC.: REVENUE, 2015-2017 ($MILLION)
FIGURE 38. APPLE INC.: REVENUE SHARE BY PRODUCTS, 2017 (%)
FIGURE 39. APPLE INC.: REVENUE SHARE BY GEOGRAPHY, 2017 (%)
FIGURE 40. BAIDU, INC.: REVENUE, 2015-2017 ($MILLION)
FIGURE 41. BAIDU, INC.: REVENUE SHARE BY SEGMENT, 2017 (%)
FIGURE 42. IBM: NET SALES, 2015-2017 ($MILLION)
FIGURE 43. IBM: REVENUE SHARE BY SEGMENT, 2017 (%)
FIGURE 44. IBM: REVENUE SHARE BY GEOGRAPHY, 2017 (%)
FIGURE 45. MICROSOFT CORPORATION: REVENUE, 2015-2017 ($MILLION)
FIGURE 46. MICROSOFT CORPORATION: REVENUE SHARE BY SEGMENT, 2017 (%)
FIGURE 47. MICROSOFT CORPORATION: REVENUE SHARE BY GEOGRAPHY, 2017 (%)
FIGURE 48. MICROSTRATEGY INCORPORATED: REVENUE, 2015-2017 ($MILLION)
FIGURE 49. MICROSTRATEGY INCORPORATED: REVENUE SHARE BY GEOGRAPHY, 2017 (%)
FIGURE 50. NVIDIA: NET SALES, 2015-2017 ($MILLION)
FIGURE 51. NVIDIA: REVENUE SHARE BY SEGMENT, 2017 (%)
FIGURE 52. NVIDIA: REVENUE SHARE BY GEOGRAPHY, 2017 (%)
FIGURE 53. VERINT SYSTEMS INC: REVENUE, 2016-2018 ($MILLION)
FIGURE 54. VERINT SYSTEMS INC: REVENUE SHARE BY SEGMENT, 2018 (%)
FIGURE 55. VERINT SYSTEMS INC: REVENUE SHARE BY GEOGRAPHY, 2018 (%)

回上頁